Getting started with Observability
Getting started with Observability as a Frontend Developer

Sandeep Ramgolam
What is Observability ?
As a frontend developer, it's easy to think we already understand Observability. After all, we can build any graphs, charts or visualizations, right ? You just describe to me your data, I will come up with the best way of representing it visually.
Turns out this is not true at all. There is a whole science behind visualizing data. This is a solved problem and nobody is interested in my pretty charts. The real value is the information we can see from the data.
This is my journey to learn the de-facto observability stack in 2025. An attempt to un-learn and re-learn.
Common words
When discussing Observability, there are three words that will come up again and again: Metrics, Logs and Traces.
- Metrics - Numbers measured over time.
- Logs - Text records of events
- Traces - The path of a request across the system (frontend -> backend -> db).
The Tools
Grafana is the "frontend" of this stack. It only helps you look at the data, it does not store or collect the data. to do that it needs something to collect metrics, for that we will use Prometheus
Challenge 1 - Observing a Macbook
Tools needed
- Node Exporter (*think api)
- Prometheus (*think db)
- Grafana (*think frontend)
Steps
- Installation
brew install node_exporter prometheus grafana
- Start the data generator (Node Exporter)
brew services start node_exporter
==> Successfully started `node_exporter` (label: homebrew.mxcl.node_exporter)
You should be able to see some stuff here: http://localhost:9100/metrics
- Configure and start the db (Prometheus)
a. Open your config file nano /opt/homebrew/etc/prometheus.yml
b. add this section
scrape_configs:
  - job_name: "prometheus"
    static_configs:
    - targets: ["localhost:9090"]

+  - job_name: "my_macbook"
+    static_configs:
+    - targets: ["localhost:9100"]
c. save the file and start prometheus brew services start prometheus
d. It should now loads in http://localhost:9090
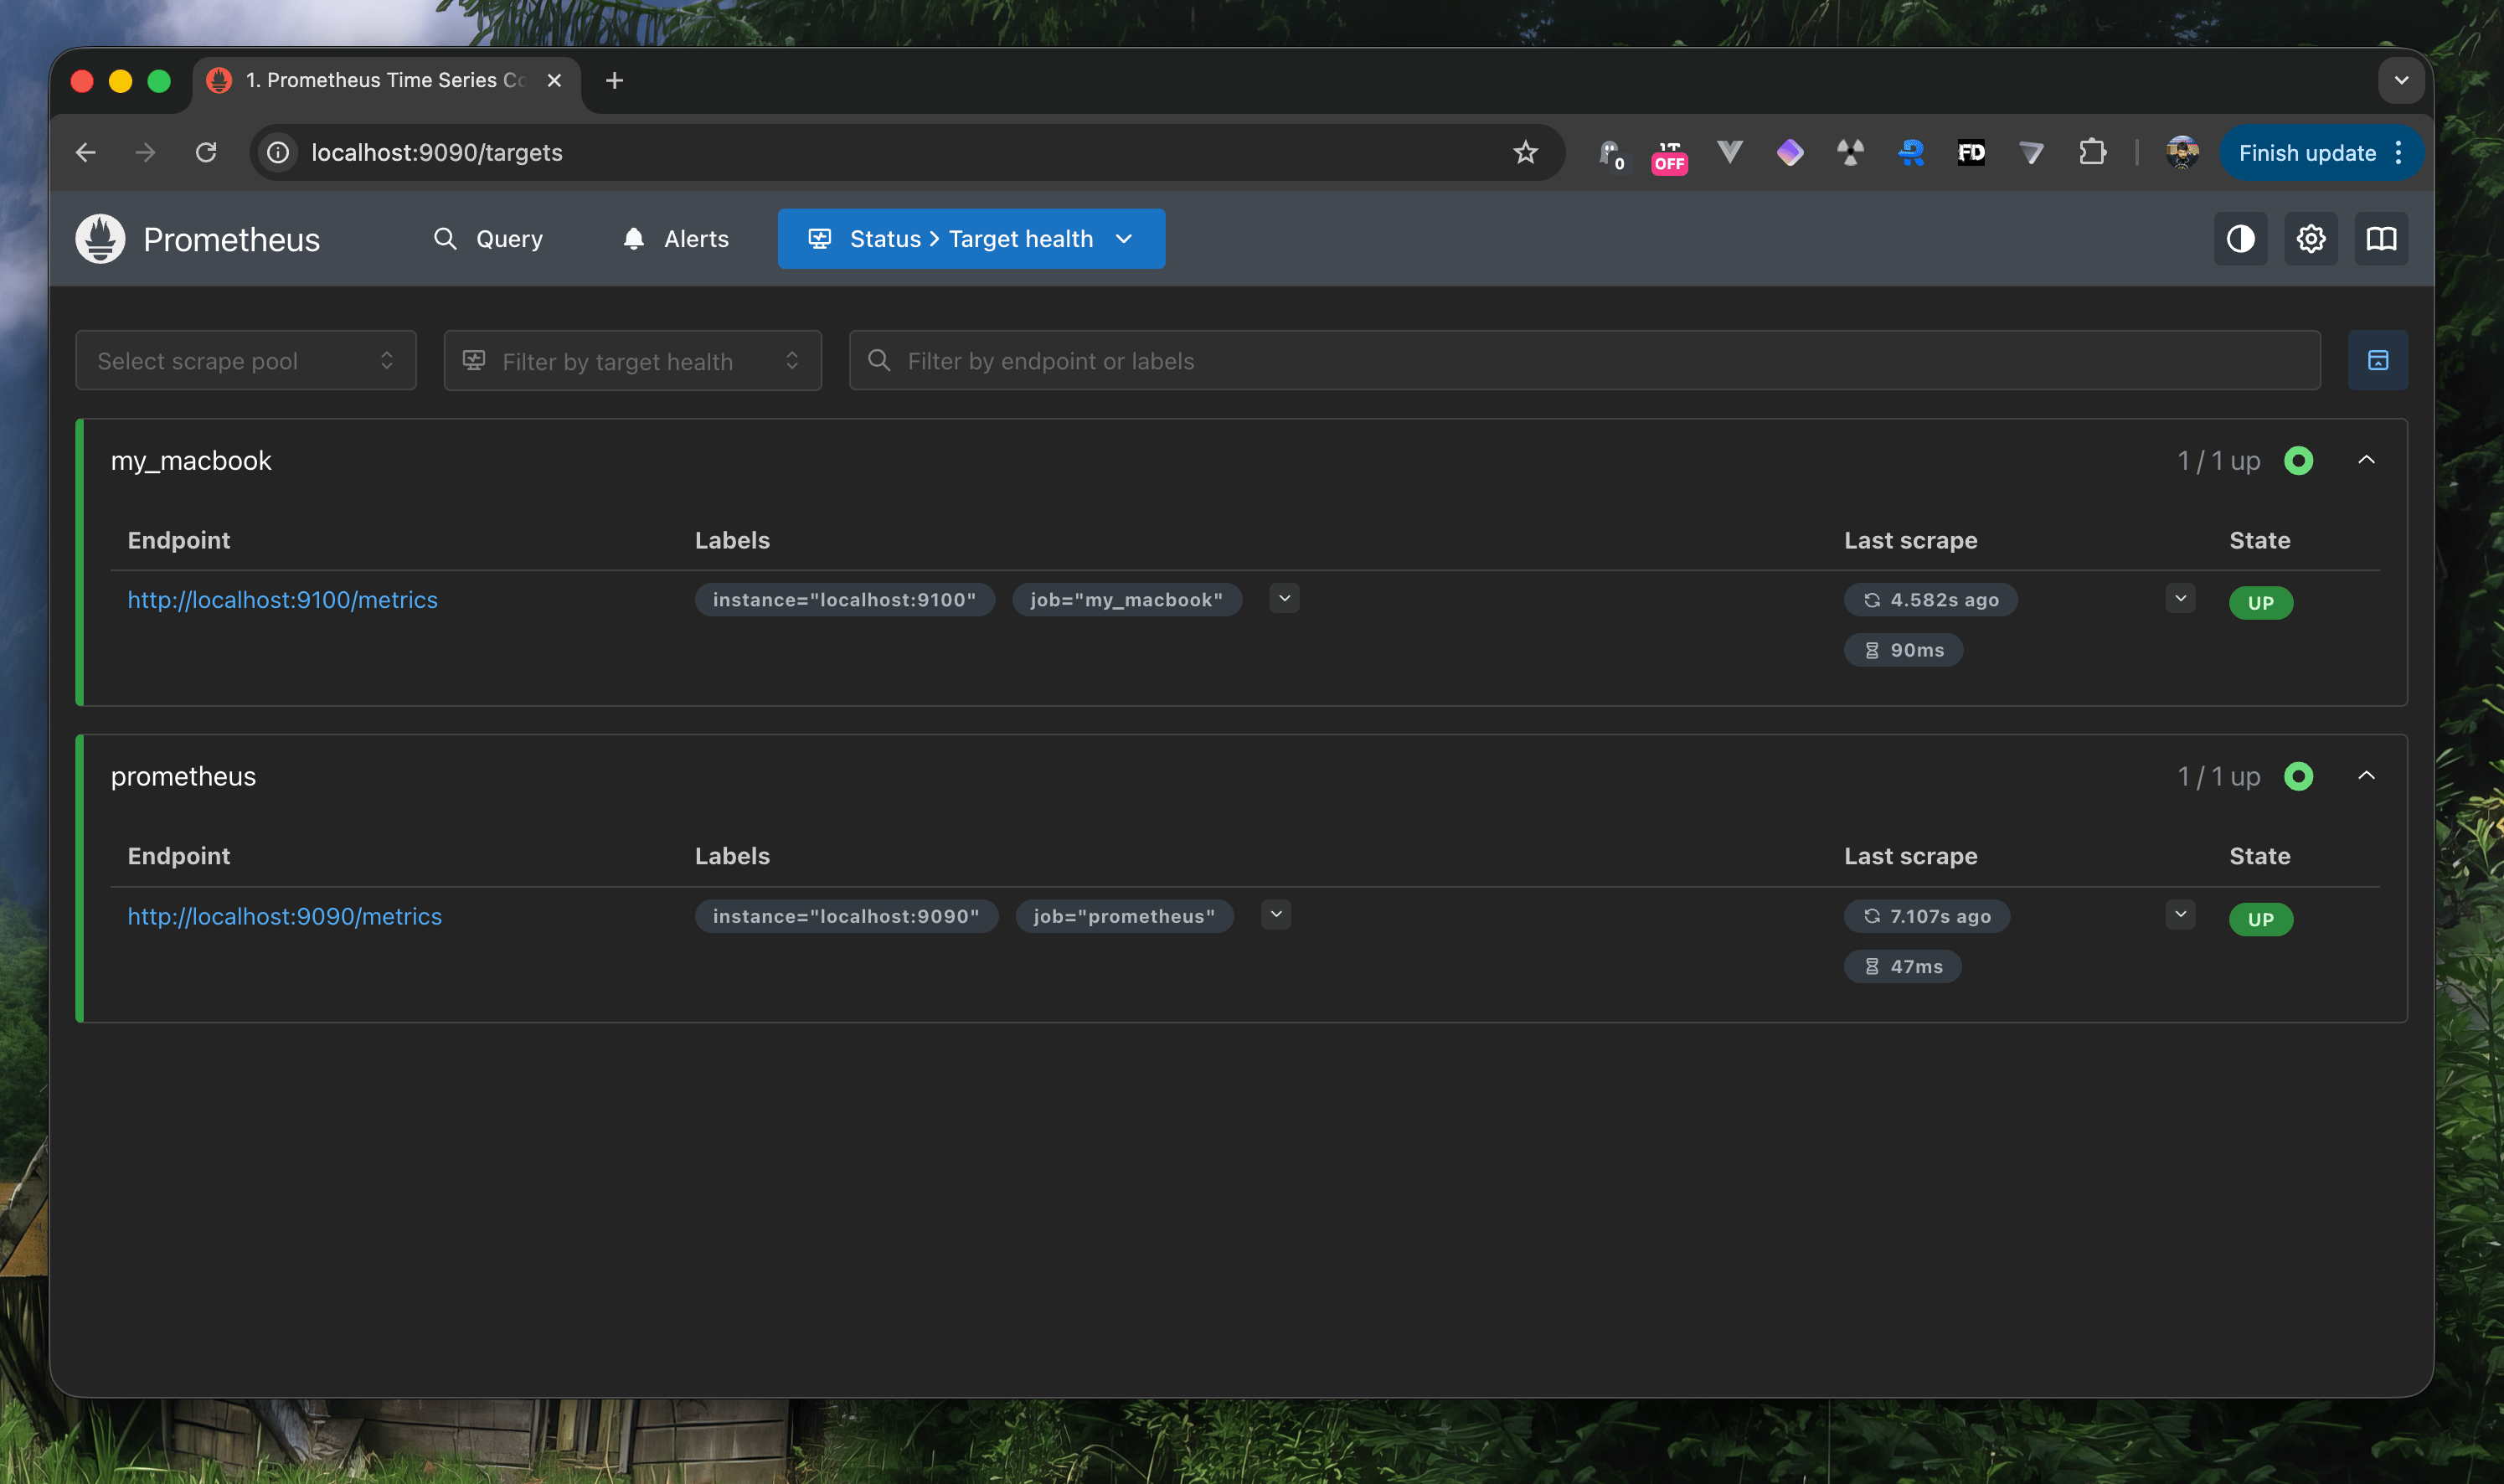
Click Status > Targets in the top menu.
You should see my_macbook listed with a state of UP (green). This means the database is successfully talking to the exporter.
- Let's visualize it
Start grafana brew services start grafana and go to http://localhost:3000.
From here we add a data source, which will connect this to prometheus.
Find it in Connections > Data sources in the sidebar, and add http://localhost:9090
There is a lot of settings here, we will ignore all of them and scroll down, "Save & Test".
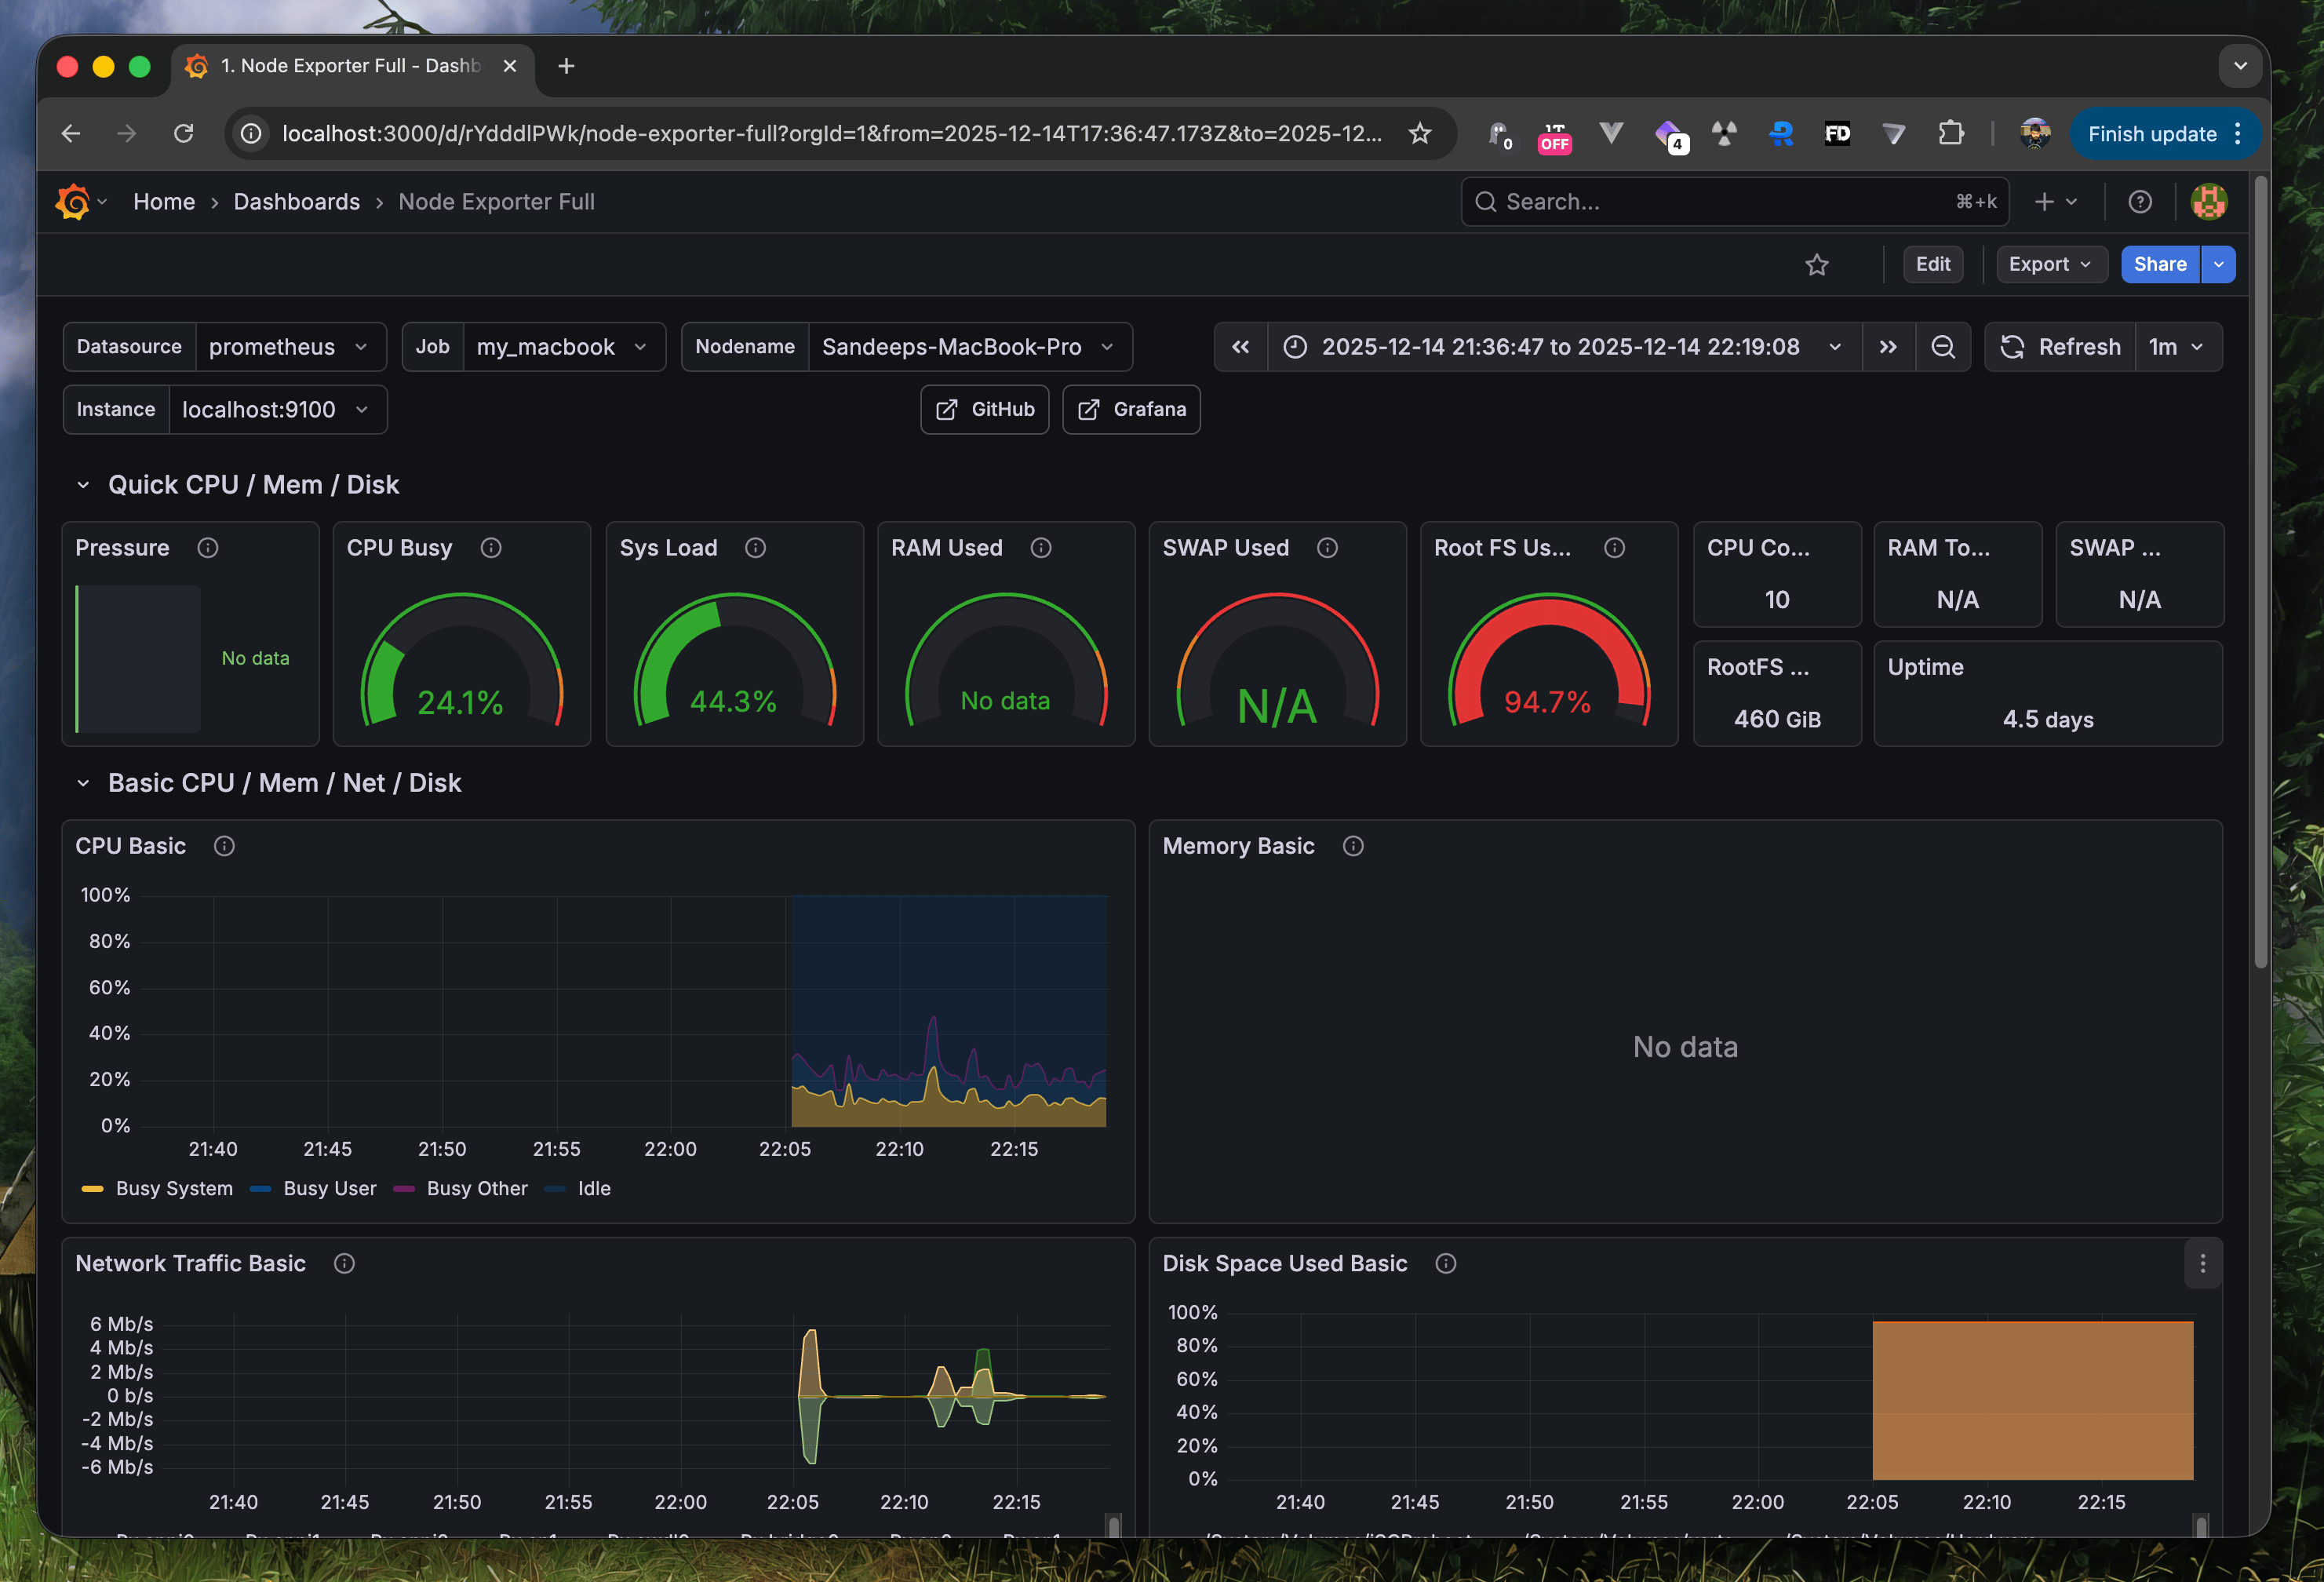
- Building a dashboard.
Actually we will not build one, we will import an existing dashboard. Dashboards > New > Import and type "1860"
Conclusion
That was fast and fun. Let's consider that a "Hello World".
Don't forget to turn off your services
brew services stop grafana
brew services stop prometheus
brew services stop node_exporter